Stock Charts with a Unique Regime Indicator
Regime Radar is my React web server and live database of stock market indicator information, with colorful charts based on the Regime. Regimes provide insight about what types of trading strategies are most valid based on the intentions of the parties that seem to be in control of the market at that time.

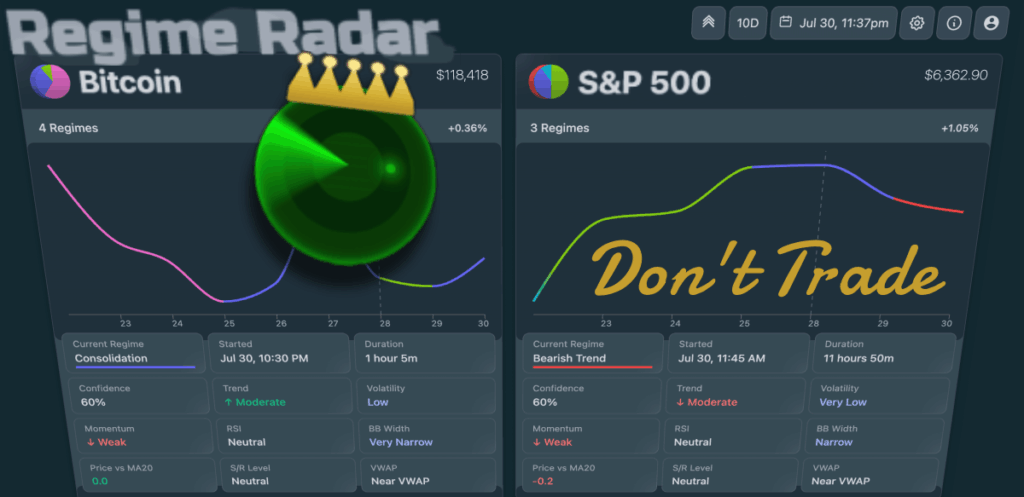
Regime Radar is a real-time technical analysis tool that helps you understand who’s in control of the markets.
Why Regimes Matter: Different trading strategies work in different market conditions.
Shifts in market dynamics tell you which party is in the pilot seat – helping you align your approach with current conditions.
For example, trend-following thrives in bullish regimes but fails in volatile, choppy markets. Mean reversion works in neutral regimes but gets crushed in strong trends.
By understanding the current regime, you can better judge which of your indicators and methods to trust, and which to treat with caution. Know when momentum traders dominate, when volatility traders have the edge, or when it’s best to stay on the sidelines.